VM Oïdium
Erysiphe necator, l'agent pathogène responsable de l'oïdium, est une maladie fongique qui constitue une menace importante pour la viticulture dans le monde entier. Sa capacité à infecter les vignes tout au long de la période de végétation en fait l'une des maladies les plus difficiles à gérer efficacement. Pour aider les viticulteurs à lutter contre ce pathogène, nous proposons un modèle de prévision qui évalue le risque d'infection et aide à déterminer le moment optimal pour les applications de fongicides. En mettant l'accent sur la précision, notre modèle permet une utilisation plus efficace des fongicides, réduisant à la fois les coûts et l'impact sur l'environnement. Dans ce wiki, nous expliquerons le modèle de prévision et où vous pouvez trouver les informations pour combattre l'oïdium.
Après avoir sélectionné une station météorologique et l'onglet « Oïdium », trois niveaux de détail du modèle de prévision de l'oïdium peuvent être sélectionnés. Les trois niveaux de détail (par ordre croissant) sont Vue générale, Vue combiné et Vue détaillée.

Vue générale
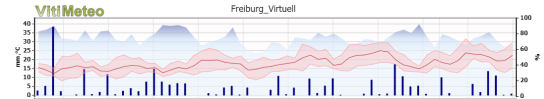
Dans cet onglet, vous trouverez toutes les informations nécessaires dans un seul graphique, qui devrait fournir une vue d'ensemble des informations les plus importantes. Dans le graphique, vous trouverez :
- Données météorologiques
- Humidité des feuilles
- Risque d'oïdium
- Croissance des feuilles

Données météorologiques
L'illustration montre :
- L'humidité (ligne bleue) indique l'humidité de l'air, qui est essentielle à la germination des spores.
- La température moyenne (ligne rouge) influence la vitesse de développement du pathogène.
- Les températures minimales et maximales (rouge clair transparent) indiquent les seuils pour le pathogène.
- Les précipitations (barres bleues) indiquent les périodes où les feuilles de vigne sont humides, ce qui crée des conditions optimales pour l'infection.
Humidité des feuilles
Sous les données météorologiques, vous trouverez une barre qui indique l'humidité des feuilles (HF). Dans la « Vue détaillée», vous pouvez voir une version plus détaillée de cette section.
Risque d'oïdium
Un code couleur indique le risque d'infection par l'oïdium. Le risque d'infection par l'oïdium est calculé sur la base de la méthode OiDiag.
- Jaune (risque faible) : le risque d'infection est inférieur à 33 %.
- Orange (risque moyen) : le risque d'infection est compris entre 34 et 66%.
- Rouge (risque élevé) : le risque d'infection est supérieur à 66%.
Croissance des feuilles
Nous dérivons notre modèle de croissance des feuilles du « Rebflächenwachstumsmodell » écrit par Schultz (2003). Le modèle décrit les éléments suivants :
- Le vert foncé indique la surface totale des feuilles (en cm²).
- Le vert clair indique la surface foliaire en cours de croissance.
- À droite, vous pouvez voir une prédiction de la croissance des feuilles pour les jours à venir.
Vue combinée
Nous dérivons notre modèle de croissance des feuilles du « Rebflächenwachstumsmodell » écrit par Schultz (2003). Le modèle décrit les éléments suivants :
L'illustration montre :
- Données météorologiques
- Humidité des feuilles
- Risque d'oïdium
- Stade BCCH
- Croissance des feuilles
Sur le côté droit de la «Vue combinée », il est possible de sélectionner :
- Info
- Légende
- Phénologie
- Durée d'action du traitement
Données météorologiques
Dans la section des données météorologiques du graphique, vous trouverez :
Données météorologiques "Kombiansicht"
- La température moyenne (ligne rouge) influence la vitesse de développement des pathogènes.
- Température minimale/maximale (gradient rouge clair)
- Les précipitations (barres bleues) indiquent les périodes où les feuilles de vigne sont humides, ce qui crée des conditions optimales pour l'infection.
- L'humidité de l'air relative (bleu clair), qui est calculée comme une valeur moyenne par jour.
Humidité des feuilles

Heures d'humectation des feuilles dans la Vue combinée
Sous les données météorologiques, vous trouverez une barre qui indique l'humidité des feuilles (HF). Dans la « Vue détaillée », vous pouvez voir une version plus détaillée de cette section.
Risque d'infection par l'Oïdium

Risque d'infection par l'oïdium
Est dérivée de la méthode "OiDiag"
Stade BBCH

Stade BBCH
Ici, vous pouvez voir ce que notre modèle juge être le stade BBCH de votre vignoble. Comparez le stade BBCH affiché à la situation de votre vignoble pour évaluer la précision du modèle.
Modèle de croissance des feuilles
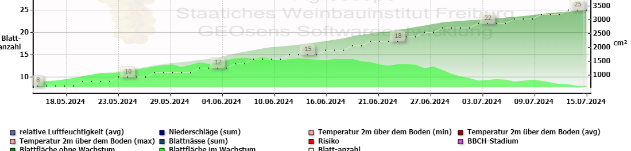
Modèle de croissance des feuilles
Nous dérivons notre modèle de croissance des feuilles du « Rebflächenwachstumsmodell » écrit par Schultz (2003). Le modèle décrit les éléments suivants :
- Le vert foncé indique la surface totale des feuilles (en cm²).
- Le vert clair indique la surface foliaire en cours de croissance.
- À droite, vous pouvez voir une prédiction de la croissance des feuilles pour les jours à venir.
Info
Vous trouverez ici des documents descriptifs sur l'utilisation de notre site web.
Légende
Décrit certains éléments du graphique
Phénologie
Ici, vous pouvez choisir si vous voulez voir le modèle de croissance des feuilles ou les stades BBCH. De plus, vous pouvez télécharger le graphique généré sous forme d'image.
Durée d'action du traitement
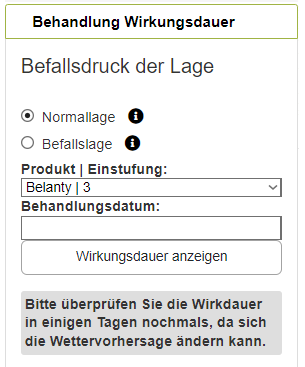
Überschrift
Dans cette section, vous pourrez voir combien de temps le fongicide de votre choix conservera son effet protecteur. Tout d'abord, choisissez si vous souhaitez analyser un vignoble avec ou sans infections au cours des années précédentes. Si vous sélectionnez « Pression maladie élevée », le facteur de risque augmentera en conséquence. Ensuite, choisissez le fongicide que vous utilisez et la date à laquelle il a été appliqué. Cliquez sur « Afficher la durée d'action » pour afficher la durée de la protection. Un graphique en dégradé noir/gris apparaît, indiquant la durée de la protection.
Durée d'action du traitement
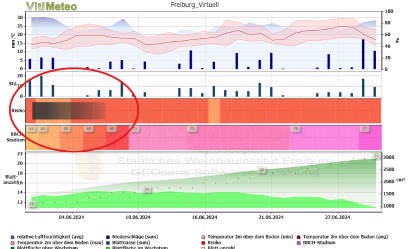
Vue détaillée
La vue détaillée fournit un aperçu approfondi des facteurs clés qui influencent le risque d'oïdium. Cette vue est particulièrement utile pour une analyse avancée et une planification précise, offrant des données détaillées qui peuvent guider les décisions. Voici ce que vous trouverez dans la Vue détaillée :
Données météorologiques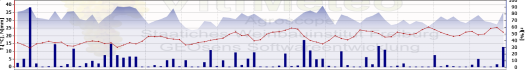
La section des données météorologiques fournit un tableau horaire des variables environnementales critiques :
- Température:
- Moyenne (ligne rouge) : Principal facteur de la vitesse de développement des pathogènes.
- Min/Max (gradient rouge clair) : Met en évidence les seuils de température affectant l'activité fongique.
- Humidité (ligne bleue) : Représente les niveaux horaires d'humidité de l'air, essentiels à la germination des spores.
- Précipitations (barres bleues) : Indique les périodes humides qui peuvent faciliter l'infection.
Ces données météorologiques détaillées permettent d'identifier avec précision les périodes propices à l'infection.
Humidité des feuilles
- Représentées sous forme de diagramme à barres, elles indiquent le nombre d'heures pendant lesquelles les feuilles restent humides (HF) tout au long de la journée.
La durée de l'humidité est en corrélation directe avec la survie des spores fongiques et le potentiel d'infection.
Utilisez ces données pour identifier les périodes prolongées d'humidité des feuilles, qui pourraient rendre nécessaires des applications supplémentaires de fongicides.
Risque d'infection par l'Oïdium
Risque d'infection par l'oïdium
- Dérivée de la méthode OiDiag, cette section fournit des calculs détaillés du risque d'infection. Plus l'indice d'oïdium est élevé, plus le risque d'infection est important.
Cette analyse temporelle très précise permet aux utilisateurs de planifier les dates d'application des fongicides.
Phénologie et stades BBCH
Affiche l'estimation par le modèle du stade BBCH actuel du vignoble.
- Cette information permet d'évaluer la précision du modèle par rapport aux stades de croissance réels de votre vignoble.
Comparez ces prévisions aux observations sur le terrain pour vous assurer que le modèle correspond à la réalité.
Modèle de croissance des feuilles
- Comme pour les autres vues, le modèle de croissance des feuilles est inclus :
- Vert foncé : Surface totale des feuilles (cm²).
- Vert clair : Surface de feuille en croissance active.
- Prévisions de croissance : Inclut une prévision précise pour les jours à venir.
Ce niveau de détail est crucial pour programmer les applications de fongicides pendant les phases de croissance rapide.
Comment utiliser le Vue détaillée
- Suivi des données horaires : Utilisez les données météorologiques et les données sur l'humidité des feuilles pour identifier les périodes où le risque d'infection est le plus élevé..
- Déterminer les pics de risque : Consultez la section relative au risque d'infection par l'oïdium pour savoir quand les niveaux de risque sont les plus élevés..
- Valider la phénologie : Comparez les prévisions du stade BBCH avec vos observations.
- S'adapter aux phases de croissance : Utilisez les prévisions de croissance foliaire pour programmer plus efficacement les applications de fongicides, en particulier pendant les périodes de croissance rapide.
La vue détaillée est un outil puissant pour ceux qui cherchent à mieux comprendre les conditions du vignoble. En utilisant ses données, les viticulteurs peuvent prendre des décisions éclairées qui améliorent la gestion des maladies et optimisent l'utilisation des fongicides.